--
kg/m²
Body Mass Index (BMI) is a simple calculation using a person's height and weight. The formula is BMI = kg/m² where kg is a person's weight in kilograms and m² is their height in metres squared. A BMI of 25.0 or more is overweight, while the healthy range is 18.5 to 24.9. BMI applies to most adults 18-65 years. BMI is used to screen for weight categories that may lead to health problems but it is not diagnostic of the body fatness or health of an individual. For children and teens, BMI is age and sex-specific and is often referred to as BMI-for-age. The interpretation of BMI for children and teens is relative to their age and sex, as the amount of body fat changes with age and differs between boys and girls. The BMI may also not accurately reflect body fatness for athletes and others with a muscular build, as muscle weighs more than fat. BMI screening is an inexpensive and easy method to screen for weight category, but it does not diagnose the body fatness or health of an individual. To determine if BMI is a health risk, a healthcare provider performs further assessments such as skinfold thickness measurements, evaluations of diet, physical activity, and family history.
This is the World Health Organization's (WHO) recommended body weight based on BMI values for adults. It is used for both men and women, age 20 or older.
| Classification | BMI (kg/m²) |
|---|---|
| Severe Thinness | < 16 |
| Moderate Thinness | 16 - 17 |
| Mild Thinness | 17 - 18.5 |
| Normal | 18.5 - 25 |
| Overweight | 25 - 30 |
| Obese Class I | 30 - 35 |
| Obese Class II | 35 - 40 |
| Obese Class III | > 40 |
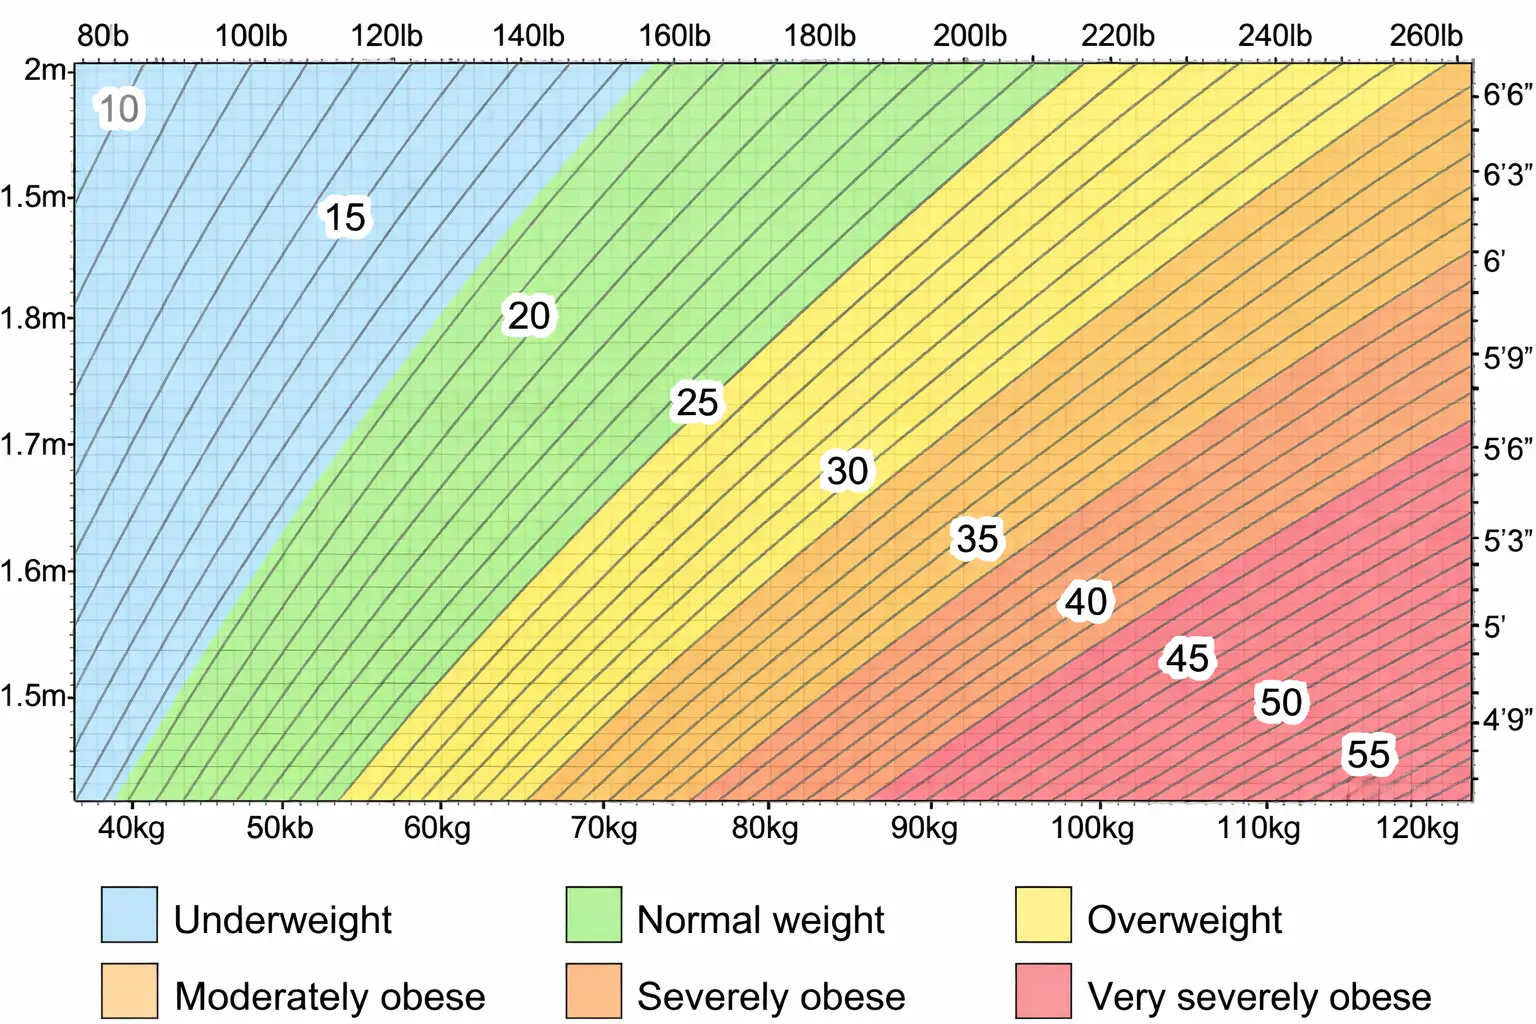
This chart shows the relationship between height and weight according to BMI categories. The colored areas represent different BMI classifications based on World Health Organization standards. The gray contour lines indicate various height-weight combinations for reference. This visual representation helps in understanding how different heights and weights correspond to BMI values and their associated health categories.